- Home
- SAP Solutions & Services
- Solutions
- Microsoft Power BI
What is Power BI?
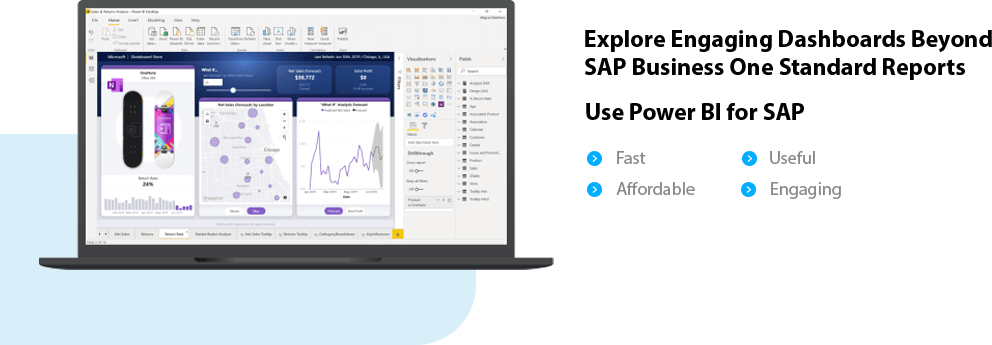
Microsoft Power BI is an affordable business analytics and intelligence service which gives interactive insights using live dashboards and rich reports with the facility of accessing data on the move from mobile devices.
At its essence, Power BI is a collection of software services, apps and connectors that work together to turn unrelated sources of data into visually appealing and easy to understand interactive insights. This data could be an Excel Spreadsheet, or a collection of cloud-based and on-premises hybrid data warehouses of your existing SAP ERP system.
In any scenario, Microsoft Power BI lets you easily connect to your data sources, visualize and discover what’s important, and share that with anyone or everyone you want.
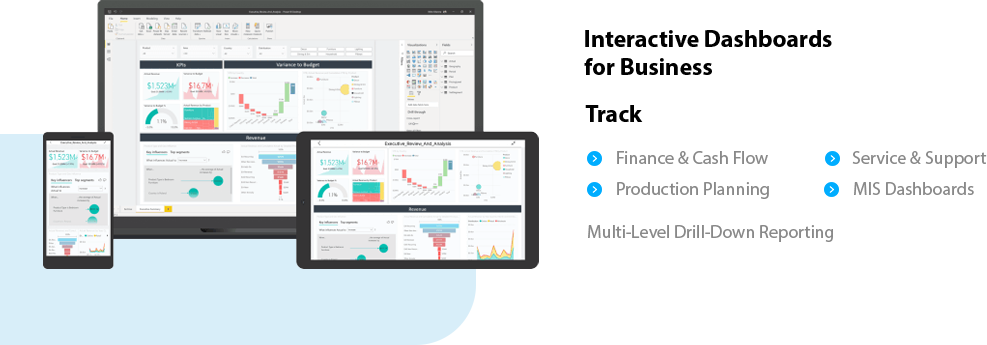
Power BI Dashboards for Business
Power BI is compatible with these SAP ERP Systems
What does Power BI let you do?
Manage a Self-Service Business Intelligence (SSBI) for your Business Operations
- Transform and Shape Data into Insights
- Shape organizational Data into Insights
- Use Data Modeling and Navigation
- Create & Share Visual Reporting Dashboards
- Develop & Import Optimized Data Models
- Use DAX functions for analysis & Visualizations
- Prepare Interactive Reports
Which Power BI element is suited to your business role?
A business may need multiple roles and functions for Power BI depending on the organization structure that needs to access and utilize business intelligence. Different Professionals in different roles will use Power BI differently.
Power BI for Senior Management
If you need to view and access already created reports and dashboards, Power BI Service is more suited to your needs.Power BI for Developers
Developers on the other hand can utilize Power BI APIs to push data into a dataset to embed dashboards into customized applications.Power BI for the Business Analyst
Create number crunching enhanced business reports using Power BI Desktop with drill down capability or tailored to the right metrics .Power BI for Department Teams
Create custom Power BI datasets to make paginated reports of whatever you need such as mailable sales invoices which senior colleagues can check as reports on smartphone.Benefits of Power BI for SAP
Pre-built dashboards & reports for popular SaaS solutions
Live, Real-time Dashboards
Secure, Live connectivity to your data sources, on-premises & in the Cloud

Intuitive data exploration using natural language query functionality
Auto insights into your datasets & reports

The Flow Of Work in Power BI
One of the most common workflows in Power BI begins by connecting to data sources in Power BI Desktop and building a report.
Publish that report from Power BI Desktop to the Power BI service, and share it so business users in the Power BI service and on mobile devices can view and interact with the report.
Many other workflows depending on your unique organization specific processes can be worked out and implemented by expert SAP Consultants such as VC ERP.

Safely Interact With Content
Whether it is dashboards, reports or apps, Power BI will offer you a great option to explore & experiment to derive relevant insights for your business.
Filtering, editing or exporting data doesn’t affect the underlying dataset or the original shared content you use in Power BI. Therefore, your data remains safe.
The changes you make affect only your view of the content you are editing. You can always revert to the original view with just a click.
Power BI & SAP
Power BI is an affordable and easy-to-use tool that can be rapidly integrated with your On-Premise SAP Data Sources.
SAP is a key enterprise BI data source and Power BI connectivity to SAP systems is a desired capability for enterprise customers who want to unlock insights from their most critical business systems.
Power BI connects to SAP S/4 HANA and Business Warehouse interfaces easily.
SAP customers who have already deployed SAP Business Warehouse have gone through the effort of integrating their transactional SAP data from SAP ECC/ERP, CRM, SRM or other business systems into SAP Business Warehouse.
Enterprise data in SAP BW has been cleansed, transformed and modelled for use in reporting, analytics and planning applications. It only makes sense that customers want to utilize what they have already invested in and connect Power BI to their data in SAP BW.
Power BI Connection Types for SAP Business Warehouse
Power BI Desktop offers two connection types for SAP Business Warehouse
Application Server Connections & Message Server Connections
Your login parameters for the Power BI desktop to log on to the SAP BW would be quite similar to logging on to SAP BW using the SAP GUI client tool. Using the Application Server connection, Power BI will always connect to the specific SAP BW Server (host or IP) in your SAP landscape.
This means that your server must be able to support such connections and the workload they bring from time-to-time without affecting the other functions the server needs to carry out.
When creating visuals in Power BI Desktop, the underlying data source in SAP BW is queried to retrieve the needed data. The time that the visual takes to update entirely depends on the performance of your SAP BW system.
Apart from importing SAP BW data, users can also import a variety of other data sources into Power BI Desktop and combine them in a single report. To maximize performance, the larger SAP BW data set can be split into smaller datasets and join them together in Power BI Desktop. Alternatively, using the built-in connector for SAP HANA, you can combine and bring together data from different SAP sources. This opens many interesting scenarios for reporting and analytics on top of your SAP data.
Power BI Supported Data Sources
SQL Database
O Data Feed
Blank Query
Azure Cloud Platform
Online Services
Blank Query
Flat Files
Other Data Sources
Hadoop, Exchange Power
Active Directory
The VC ERP Action Plan for Power BI Migration
The VC ERP Action Plan for Power BI Implementation
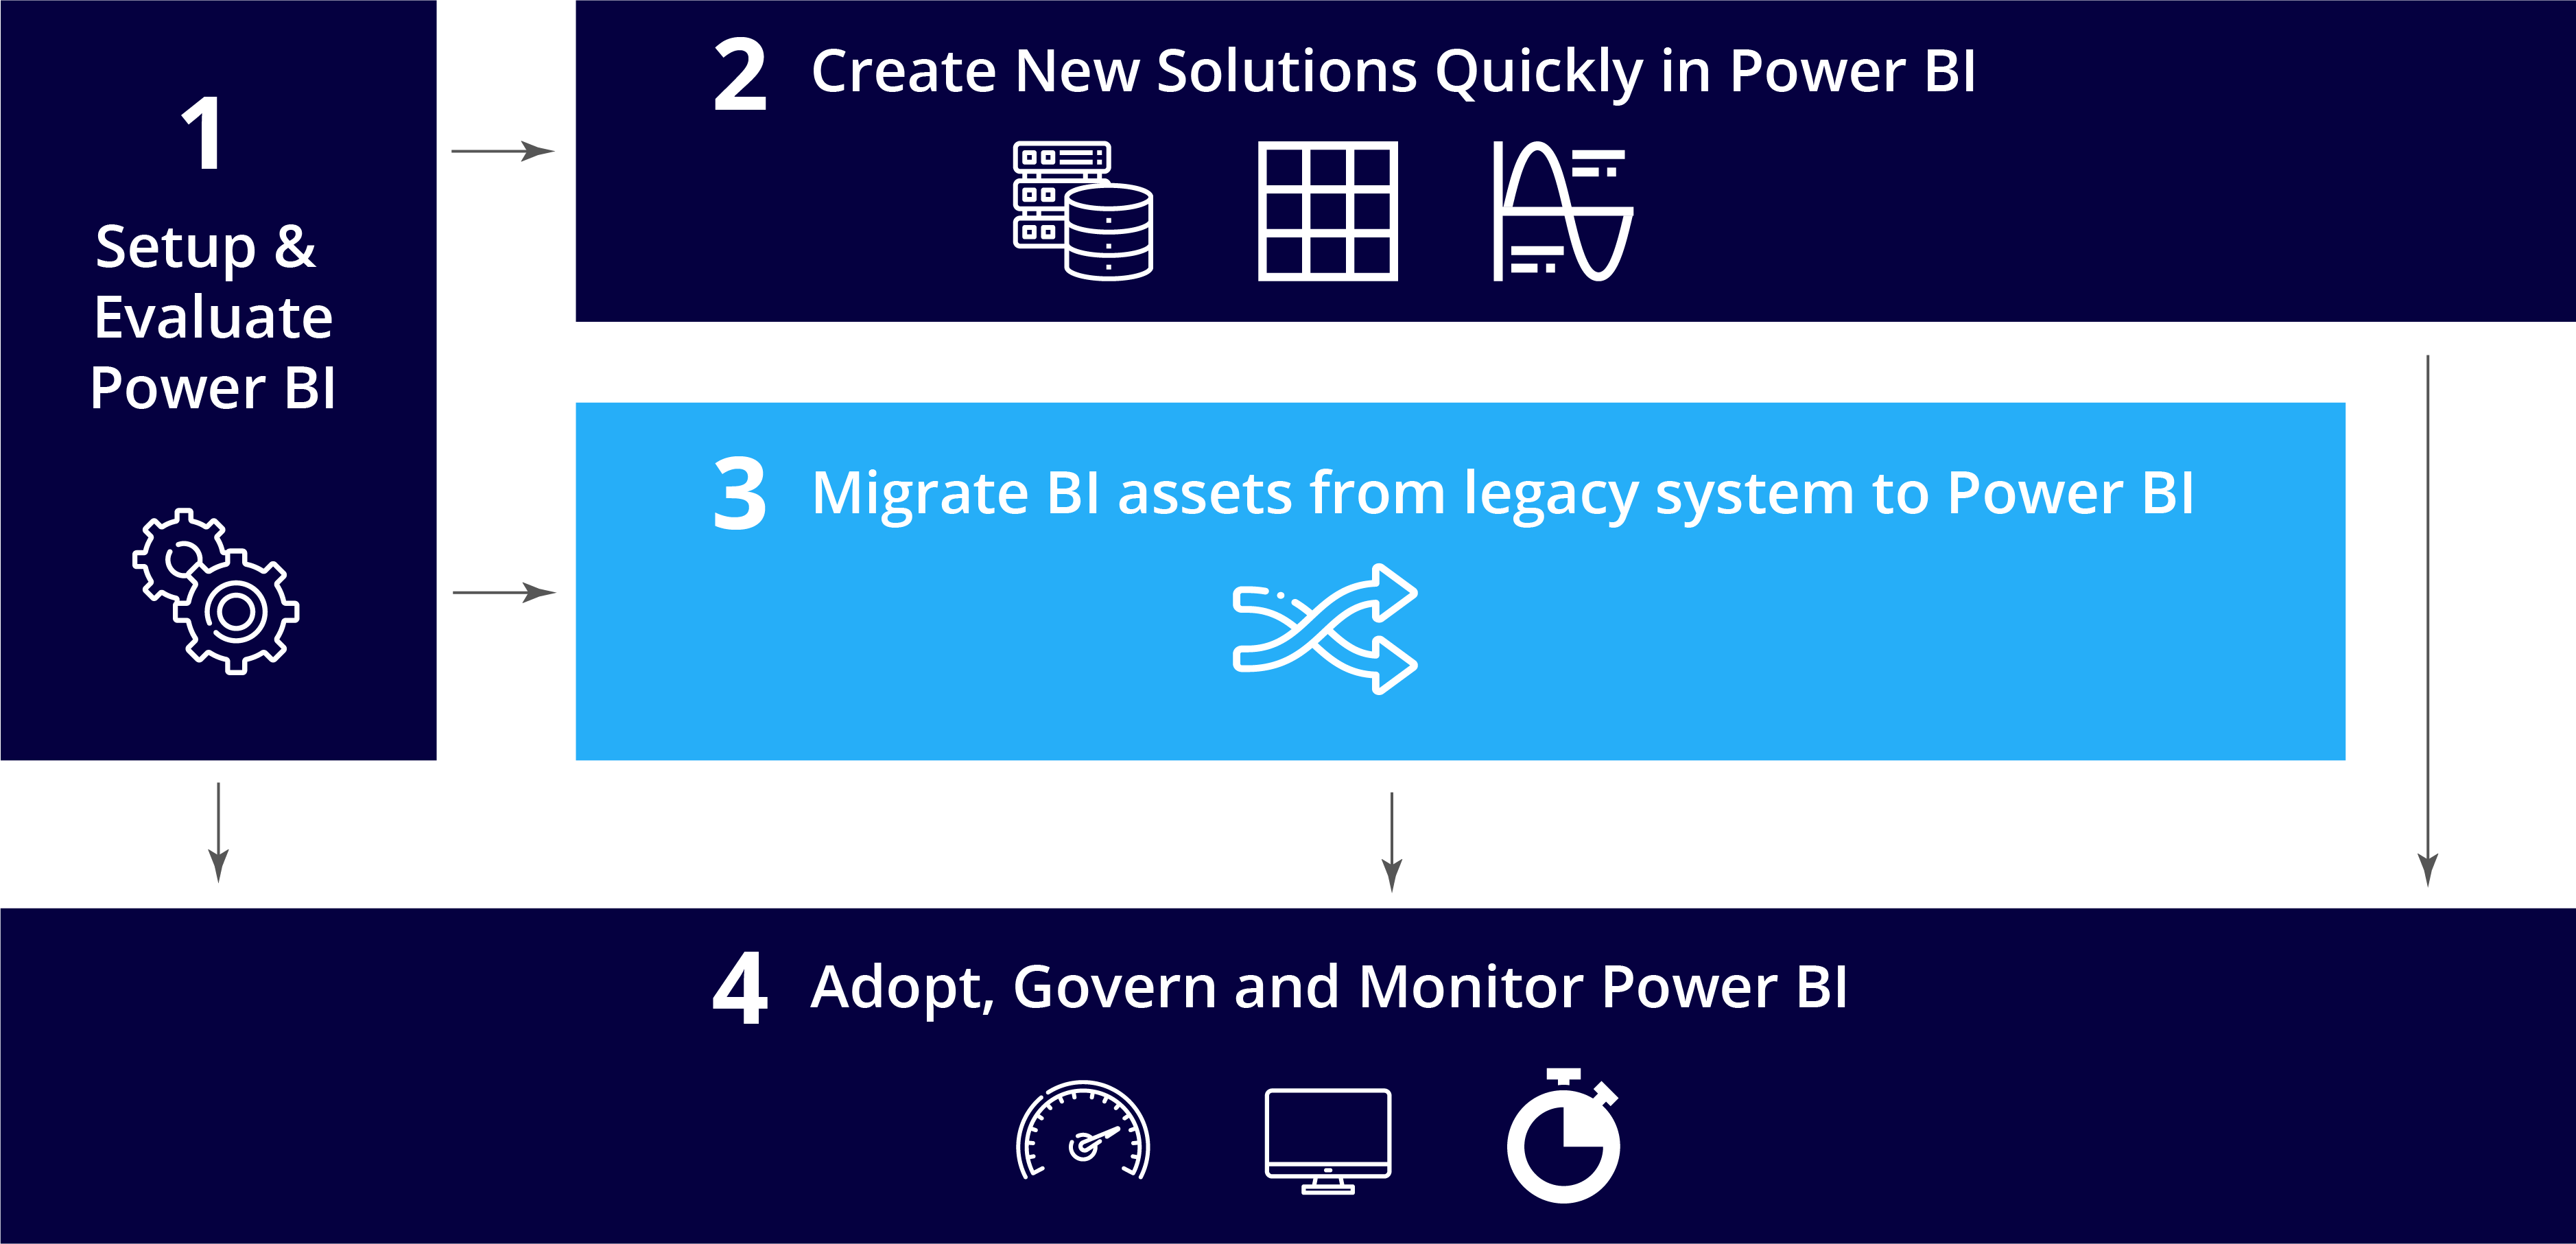
Phase 1: Setup and Evaluate Power BI
Establish the initial architecture. This phase is all about planning governance & preliminary deployment along with a careful cost vs benefit analysis.Phase 2: Creating Dashboards and Reports
Evaluating Power BI by the End-User from the organization so needs and functionality can be carefully assessed hand-in-hand with the migration.Phase 3: Migrate BI Assets from Legacy
Organization structure, existing data management & maintenance, data management maturity & enterprise goals need to be understoodPhase 4: Adopt, Govern & Monitor Power BI
Nurture data culture, communication & training.Policy level changes and change management is done to address resistance-to-change within employees.Explore Our Expert Insights on Power BI
Top Ways Power BI Shares Compelling Business Insights with Data Visualization
Tips for Creating a Successful Digital Transformation Roadmap for Total Business Management