


From Numbers to Narrative: Building Powerful Dashboards in Power BI

Whether you're trying to streamline your operations, boost your sales, or optimize your marketing strategies, Power BI can provide you with the insights and analytics you need to succeed.
But how?
Power BI is a user-friendly Business Intelligence solution that stands apart thanks to its intuitive GUI. You can quickly and easily generate dynamic dashboards without any coding expertise. Just drag and drop some features, and you can create interactive Power BI dashboards for any business function within minutes.
Power BI dashboards are fast and easy to read, visually attractive and responsive to both mouse or touch inputs. These dashboards are used by C-level executives and decision-makers, offering a comprehensive overview of various metrics from multiple data sources on a single page.
Want to know what makes Power BI dashboards so great for your business?
Today Business Intelligence Experts at VC ERP Consulting share tips on Power BI dashboard best practices and how VC ERP does it.
Power BI Dashboards: 4 reasons why they are the Drivers of Business Growth
The purpose of a Power BI dashboard is to help C-level executives gain valuable insights and make data-driven decisions.
Power BI dashboards help users identify trends, patterns, and anomalies that might not be apparent when looking at raw data. It does this by consolidating data from various sources and presenting it in an easy-to-understand format.
They also enable users to drill down into specific data sets to gain a deeper understanding of their business operations. Power BI dashboards allow users to explore data in a more intuitive way by providing a level of interactivity that traditional static reports cannot match.
Let us have a look at the 4 reasons that make Power BI Dashboards a worthwhile investment.
Intelligent Reporting makes your Data Visualization a breeze
- Analyze data from various sources and gain insights quickly with drag-and-drop interface & pre-built visualizations
- Receive intelligent recommendations helping you to create engaging and informative reports
- Serving as the combination of user-friendly interface and advanced analytics capabilities
Save time and achieve more with intuitive dashboards
- Spend more time analyzing and discussing insights rather than searching for information
- Reduce learning curve for new team members improving team efficiency and productivity
- Achieve valuable insights that boosts productivity, collaboration and decision-making process
Streamline Data-driven decision making
- Tell the data narrative rather than visualizing numbers helping you to make data-driven decisions
- View the big picture as well as the minute details of data with intuitive drill down features
- View and analyze data from multiple contexts simultaneously
Unifying data sources with robust integration capabilities
- Analyze huge amount of data from multiple data sources such as
- Microsoft Excel
- MySQL database
- SQL Server database
- Oracle database
- IBM Netezza
- IBM DB2 database
- IBM Informix
- Sybase database
- PostgreSQL database
- SAP Hana
- Salesforce
- Azure SQL Database
- Amazon Redshift
- Azure SQL
- Azure Analysis Services database
- Data warehouse
- MailChimp
- Azure Blob Storage
- GitHub
The above list of data sources is just an example of how extensive Power BI is when it comes to pulling data from data sources. In its true sense, there are even more data sources that you can choose from.
Optimizing Business Processes with Power BI Dashboards: Use Cases
Tell the story of your critical business data for all the departments within your business and make informed business decisions with Power BI.
Here are some examples of departments that can benefit from using Power BI:
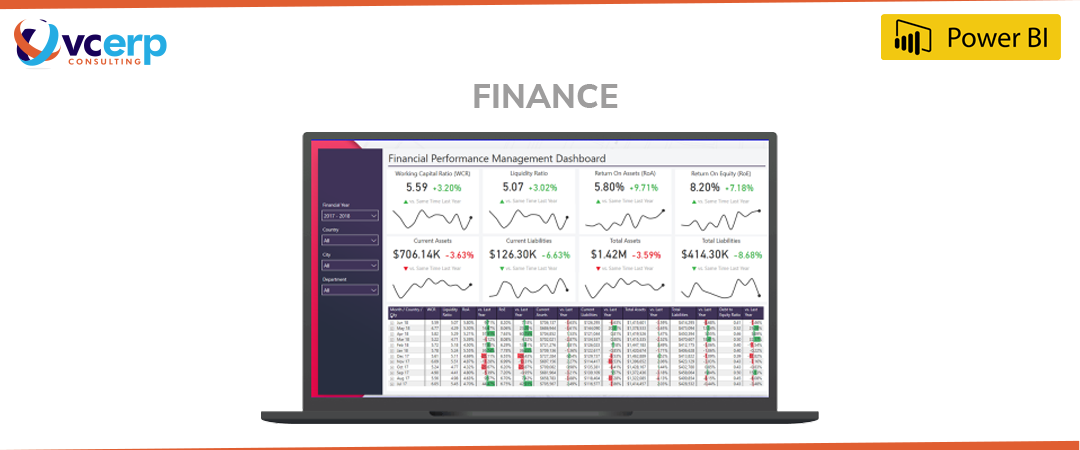
Finance
Monitor your financial performance, identify trends, and forecast future revenue. Create interactive reports and dashboards that help you visualize and analyze overall revenue, profit, total customers, performance by region and much more.
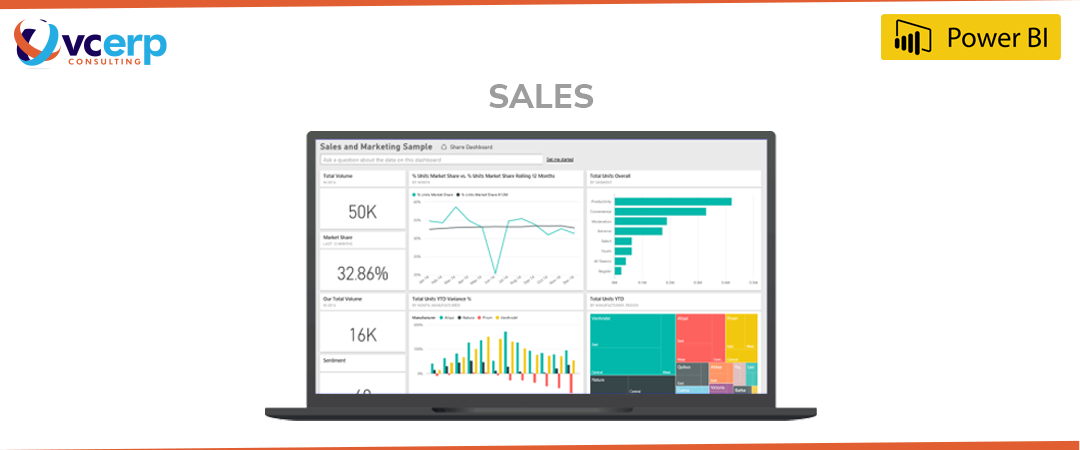
Sales
Track employee performance, analyze customer behavior and identify trends in sales data with Power BI Sales Dashboards. Create dashboards that provide a real-time view of your team’s performance and identify areas of improvement.
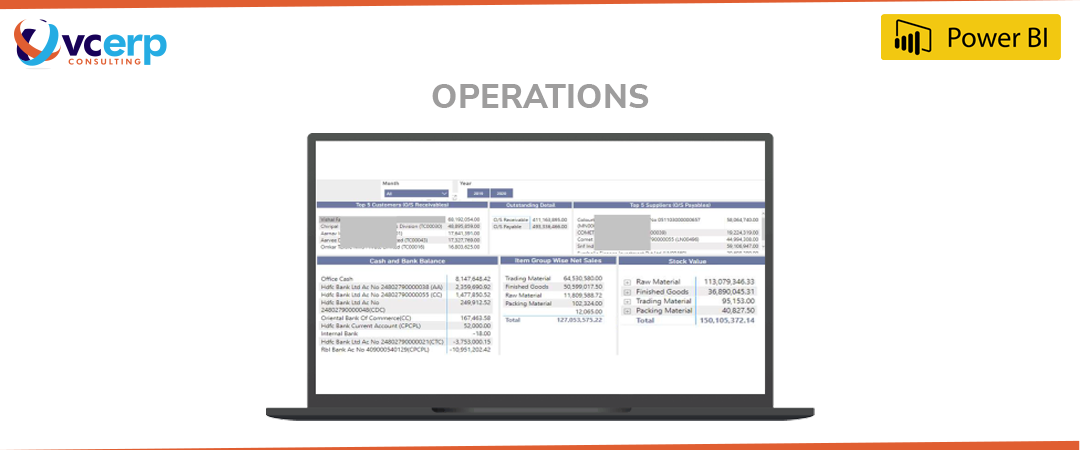
Operations
Get insights on operational KPIs such as profit, loss, net revenue, customer retention, etc. identify bottlenecks and get insights on investor summaries as well as financial overviews.
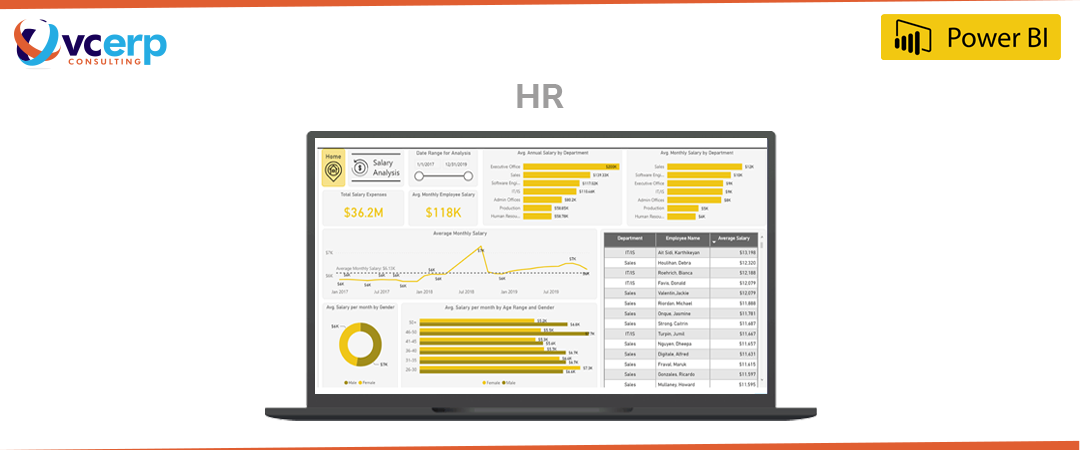
HR
Track employee data, such as headcount, turnover and performance metrics and create dashboards that provide insights into workforce trends and help identify areas for improvement. Find the total number of employees, average salary, age, newly joined employees, and lots of other employee-related insights.
Marketing
Measure the effectiveness of campaigns, track return on investment (ROI), analyze customer data, such as demographics and behavior, to develop targeted campaigns that resonate with your audience.
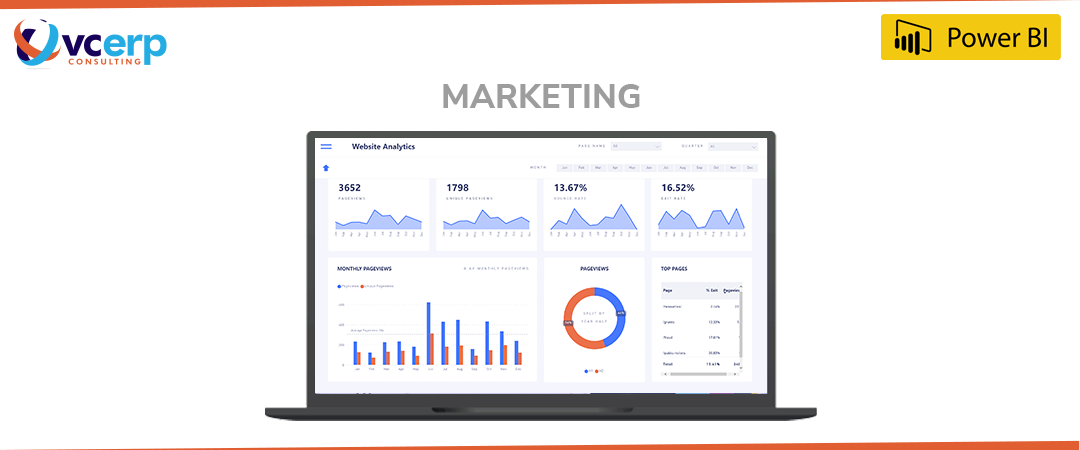
Please Note: The dashboard images mentioned above are just examples of what they look like. You have the power to request our Business Intelligence experts to ask for KPIs per your unique needs. What it means is that you can completely customize the Power BI dashboards according to your business requirements.
Now let’s take a look at the top benefits of using Power BI Dashboards for data analysis and reporting.
Benefits of implementing Power BI Dashboards for your Business
On its own, data is just numbers - it’s up to the report creator to decide what to do with it.
There are many decisions you must make when you’re creating your Power BI dashboard, such as what visuals to include, which colors to use, and how to lay it all out in a single view. All these factors are important to ensure a top-notch user experience.
Imagine you run an apparel business and sell clothes on your website globally, and receive thousands of queries and sales each day from customers. In addition, you’re also running marketing campaigns to improve your sales.
Now, how will you answer the following questions:
- What is the top-selling product?
- What is the total number of customers that you have acquired in a particular week?
- What is the net profit for a particular month?
- What is the performance of your marketing campaign in a specific region?
- What is the total revenue generated for a particular month?
- From which region are the majority of purchases being made by customers?
To answer these questions, manually checking data for a large number of customers would not only be time-consuming but also prone to errors.
This is where Power BI can come in handy, allowing for quick and accurate analysis of large datasets to extract valuable insights and answer these types of questions efficiently.
Power BI Dashboards are a powerful tool for data analysis and visualization, allowing you to quickly and easily transform large and complex datasets into intuitive and interactive visualizations. With its drag-and-drop interface and customizable dashboards, you can quickly analyze and gain insights from your data, making informed business decisions that can drive growth and success.
Plus, the ability to connect to various data sources, including structured, semi-structured, and unstructured data, allows you to easily consolidate and analyze data from multiple sources in one place.
Build Interactive Dashboards with Power BI Today!
Power BI is a vital tool for businesses that handle large amounts of data daily, as it offers no-code drag-and-drop functionality, ease of use, and customization. With Power BI, you can present complex information through visualizations such as pie charts, donut charts, bar charts, and linear charts, enabling data-driven decision-making.
However, it's essential to engage the services of a Power BI implementation partner such as VC ERP Consulting, the best Power BI implementation partner in India, to implement Power BI for your business. Power BI experts at VC ERP Consulting develop department, business function and industry-specific Power BI reporting dashboards.
These dashboards help you see the “Big Picture” without compromising the attention to detail when it comes to your business processes. Explore critical business information at fingertips and make well-informed business decisions to understand your diversified business landscape.
Get in touch with our expert Power BI Consultants & advisors at VC ERP Consulting.
Call +91 7948998911 (India), Whatsapp +254 111229970 (Kenya), Call +1 469 9156026 (North America), +974 31239246 (MENA) or drop an E-mail at sayhello@vc-erp.com


How Microsoft Power BI positions SME Businesses for Success

Power BI vs SAC: Which BI Solution Reigns Supreme in Business Intelligence?
VC ERP Consulting × Your Business- Let’s Unleash Your Business’s Potential. Together.
We believe that success begins with meaningful connections. That's why we invite you to start a conversation with us.
Our Partners


Let’s Do This. Contact Us!
Apply for Job
"*" indicates required fields