


How to Transform your Sales Strategy with Power BI Sales Dashboards

Any organization primarily measures its growth in terms of sales. An increment in Sales can be attributed to more customers, revenue and profits.
Earlier the sales data was tracked and analyzed manually in excel sheets but now analyzing sales data such as prospect leads, top regions, peak months etc has become more complex due to huge amounts of varying and dynamic data. With an ever-evolving market and a massive amount of data available, your sales team’s job of knowing their customer base isn’t easy. Board of Directors, Senior Management and Leaders are looking for real-time sales information and mechanisms to decrease their sales analysis time.
Instead of solely focusing on dissecting the customer data in front of them, sales reps can now easily ook for data visualization to pull out insights not apparent at first glance.
Microsoft Power BI is designed to help businesses gives power to the Top Management, Sales HODs, Finance Teams to collect, unify and visualize all their data in one place. It’s cloud-based and compatible with 59 different applications which simplifies the process.
In this article, Power BI Experts at VC ERP Consulting guide business owners to improve their sales strategy with interactive Power BI Dashboards. Let us first understand the basics and importance of Power BI.
What is Microsoft Power BI?
Power BI is a self-service business intelligence tool bringing data analytics to its employees by creating data models before disseminating reports throughout the business.
It is an affordable business analytics and intelligence tool which provides interactive business insights using live dashboards and rich reports. In fact, you can even access critical business data on-the-move simply using your smartphone.
Microsoft Power BI Solution provides a unique set of features that empowers every business user to benefit from direct access to critical data and real-time business insights.
What is Power BI’s Unique Value Proposition for Your Company?
Power BI stands out with streamlined publication meaning seamless transition of numbers into engaging dashboards. In addition, it offers seamless integration with other Microsoft products and services. But what makes it an excellent good choice for your company?
Here are some of the many reasons Microsoft Power BI is an excellent reporting mechanism for your business:
Get flexibility. Make custom dashboards using various data sources as Power BI gets easily integrated with more than one database at a time
- Get instant insights with an uncomplicated setup and no required training
- Upload reports & visualizations to get up-to-date business data
- Solve problems & drill-down to identify opportunities using automated real-time data updates translating into visuals
- Customize navigation to help viewers find content quickly
- Easily understand the correlation between different reports and dashboards
- Set up row-level security (RLS) access filters to ensure that viewers see only data relevant to them, mitigating the risk of people seeing data they shouldn’t
- Verbally ask questions in natural language to access charts and graphs with Cortana Integration
Now that we understand the importance of Power BI for your business, let us dive deeper into transforming your sales strategy with Power Bi.
Transform Your Sales Strategy with Power BI Sales Dashboards with VC ERP Consulting
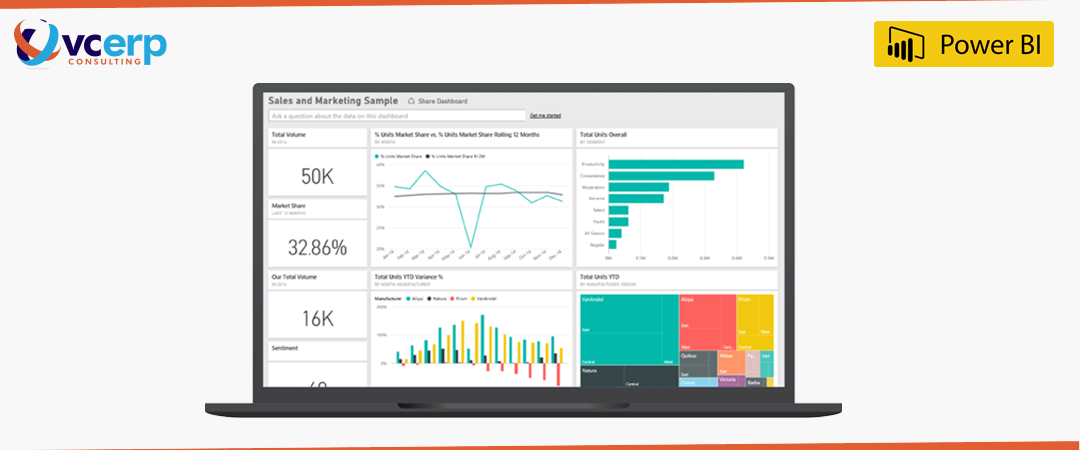
Sales Dashboards designed by Microsoft Gold Partner, VC ERP Consulting break down complex information into handy chunks of information. This information is in turn used to obtain actionable realtime insights with engaging visuals.
Simply put, the role of our custom Sales Dashboard is to extract the most actionable information from your CRM (Customer Relationship Management) system.
This information is then presented in a more palatable format through engaging visuals accompanying drill-down capabilities and department-specific KPIs.
Get a comprehensive glance at your Sales teams’ performance and see where you stand vis-a-vis your company’s revenue targets.
Strategize to effectively reach those revenue targets within the set deadline with clarity obtained through Microsoft Power BI Dashboards developed by VC ERP Consulting.
- Track progress towards goals
- Make decisions and plans based on your team’s performance
- Track KPIs and recognize the efforts of your employees across the organization
- Identify key issues before they snowball into major problems for the enterprise
Here are seven ways sales dashboards developed by VC ERP Consulting can transform your sales processes:
1. Increase Sales Productivity with Custom Sales Dashboards
- Eliminate difficult & time-consuming manual reports & replace them with VC ERP Consulting custom sales dashboards
- Our in-house Power BI Experts undertake data modeling to automate daily transactions into actionable insights with engaging visuals
- Generate pipeline reports and sales trends within hours, minutes or even seconds instead of days
- Get plenty of extra time to review and develop thoughtful strategies
2. Seamless Data Sharing across Various Departments
- Power BI custom sales dashboards developed by VC ERP Consulting support nearly 60 applications
- Easily share away important insights with peers, colleagues, investors and the Board through emails, messaging and more
- Import critical business data from different departments and cross-collaborate with your peers
- Re-align your strategies by achieving complete visibility across all your departments
3. Achieve Sales Targets with Quota Management
- Set realistic quotas in this ever-changing markets by keeping in mind all the variables - region, month and customer segment
- Eliminate the difficulties of setting quotas by gathering past and present data in one place and set attainable future targets with ready comparisons
4. Compare Sales Data across Different Timeframes
- Compare sales data for Year to Year (YoY), Month to Month (MoM) and Quarter to Quarter (Q2Q)
- Gauge actual vs targeted sales comparison for various time periods
- Compare sales targets, forecast sales trends and plan production as per the latest demand supply
5. Measure Sales across Locations & Territories
- Achieve complete visibility of your business operations by measuring sales across locations & territories
- Tap the untapped markets and expand your business across various locations by sales forecast for products for all the desired locations
6. Get Instant Insights for all SKUs
- Stay constantly updated about brand-wise and product-wise sales
- Keep up with production and inventory levels with up-to-date insights
- Streamline your operations with complete visibility across stores
7. Measure Sales Performance KPIs
- Gauge employee performance with the latest insights with a unified view of data
- Measure sales team progress against strategic goals
- Get insights about sales trends or patterns presented by interactive business data
- Make strategic business decisions with deeper exploration through drill-down
Get Insightful Power BI Sales Dashboards with VC ERP Consulting Today!
Combine the different aspects of developing high-quality Power BI reports with the best Microsoft Gold Partner, VC ERP Consulting. Drill down to any aspect of your critical business data quickly with Power BI Dashboards developed by VC ERP Consulting.
These dashboards help you see the “Big Picture” without compromising the attention to detail when it comes to your sales, who’s making them, who you’re making your sales to and where you’re making them all!
This information and much deeper insights can be explored at your fingertips once you integrate these Sales Dashboards with your existing technology ecosystem. Make quick & well-informed business decisions and understand your diversified business landscape.
Get in touch with our expert Power BI Consultants & advisors at VC ERP Consulting. Call +91 7948998911 (India), Whatsapp +254 111229970 (Kenya), Call +1 469 915 6026 (North America) or drop an E-mail at sayhello@vc-erp.com


How Microsoft Power BI positions SME Businesses for Success

Power BI vs SAC: Which BI Solution Reigns Supreme in Business Intelligence?
VC ERP Consulting × Your Business- Let’s Unleash Your Business’s Potential. Together.
We believe that success begins with meaningful connections. That's why we invite you to start a conversation with us.
Our Partners


Let’s Do This. Contact Us!
Apply for Job
"*" indicates required fields