


The Top 4 Power BI Dashboards Every Business Must Have

In the times when Data has literally become the new currency, the ability to transform raw numbers into actionable insights is a game-changer for any business to establish their own industry benchmarks. For C-suite executives, Founders, Directors, and Senior Managers, timely access to the right data isn't just about oversight—it’s about forward-thinking and strategic planning.
Why are Power BI Business Dashboards Necessary?
Strategic Decision Making
In the boardrooms, where impactful decisions are made, dashboards present a synthesized view of the company’s health and direction. Key Performance Indicators (KPIs) serve as the compass for strategic initiatives, pivots, or expansions.
Routine Monitoring
For top-tier executives, tracking real-time progress against set benchmarks becomes effortless. Instead of delving into extensive reports, a glance at a dashboard can offer a snapshot of where the business stands.
Informed Discussions
When discussing company trajectories with stakeholders, having data-backed narratives enhances confidence and clarity. It's about facilitating conversations that are both informative and decisive.
Efficiency & Engagement
The beauty of Microsoft Power BI, as implemented by VC ERP Consulting Pvt Ltd, is its no-code feature. Once connected to data sources, these dashboards come to life, displaying information that’s both engaging and relevant.
This isn’t just about convenience but about efficiency; the faster data can be understood, the quicker decisions can be made.
To learn more about how Power BI transforms business intelligence, explore Power BI Services here.
Data insights need visualizing and interpreting business data in a way that makes sense to all stakeholders. VC ERP Consulting Pvt Ltd streamlines this process by delivering tailored Power BI business dashboards that require no coding expertise. Let’s dive into the top four dashboards that are a must-have for any business to succeed.
Let’s dive into the top four dashboards that VC ERP Consulting customizes for enterprises using Microsoft Power BI
- AR Dashboard
- AP Dashboard
- Sales Dashboard
- Custom Drill Down Interactive Dashboards
The Top 4 No Code Power BI Dashboards Every Business Must Have
AR (Accounts Receivable) Dashboard
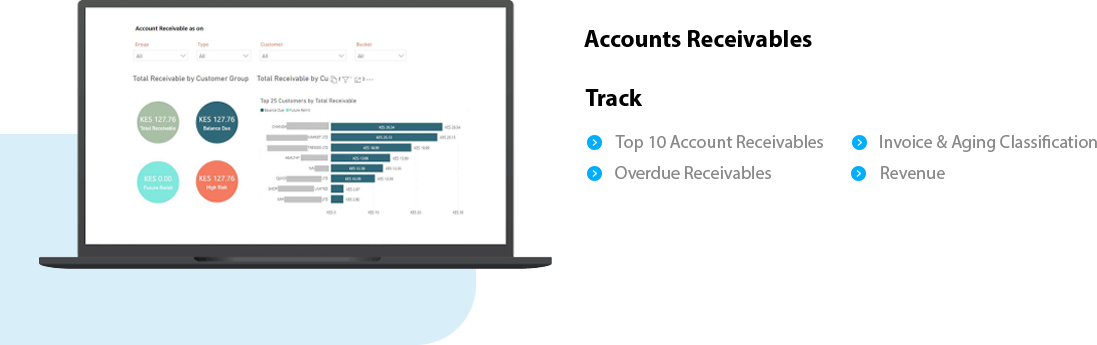
- Outstanding Invoices: Provides an immediate view of unpaid customer invoices.
- Payment Durations: Shows how long it takes, on average, for customers to settle their debts.
- Customer Payment Behavior: Identifies which customers are timely payers and which are frequently late.
- Cash Flow Insight: Offers a snapshot of money owed to the business.
The AR Dashboard is essential for gauging an organization's financial health, providing a comprehensive view of money due. Through this visualization, businesses can improve their collection strategies and prioritize outreach efforts.
AP (Accounts Payable) Dashboard
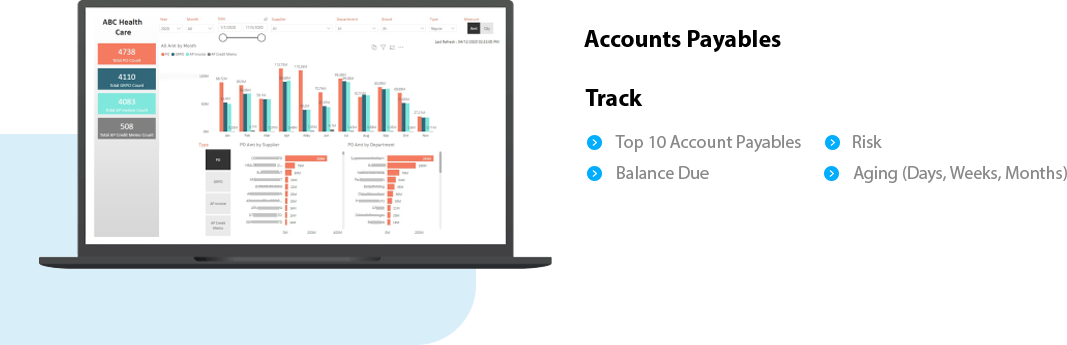
- Pending Bills Overview: A clear picture of upcoming financial obligations.
- Vendor Payment Histories: Track and analyze previous payments made to vendors.
- Invoice Aging Reports: Highlights overdue bills that require immediate attention.
- Budgeting Tool: Assists in the allocation and forecasting of funds.
The AP Dashboard is crucial for monitoring and managing outgoing cash flows. By centralizing this data, organizations can ensure timely payments and strengthen vendor relations, leading to potential discounts and improved supply chain efficiency.
Sales Dashboard

- Lead Conversion Rates: Measures the efficiency of the sales process from lead generation to conversion.
- Regional Sales Performance: Breaks down sales figures by region, identifying high-performing areas and potential growth markets.
- Sales Representative Metrics: Track individual sales performances, spotlighting top achievers and those who might benefit from additional training.
- Product Performance: Understand which products or services are best-sellers and which might require promotional efforts.
The Sales Dashboard provides businesses with deep insights into their sales activities, aiding in strategy refinement, resource allocation, and growth initiatives.
Custom Interactive Dashboards with Drill Down Capability
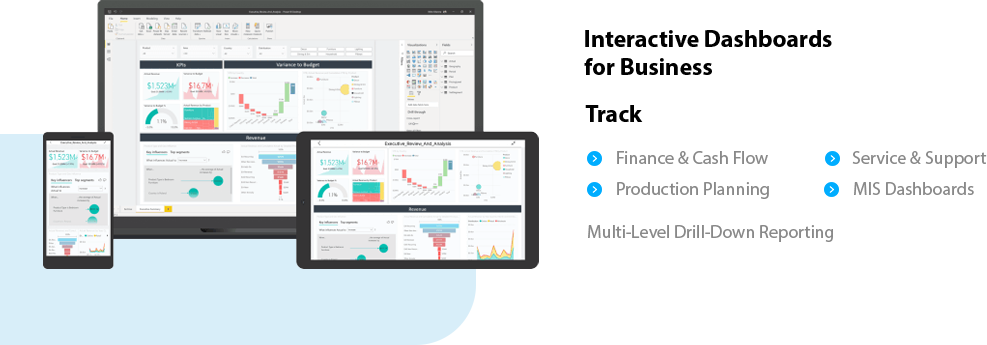
- Drill-Down Features: Explore specific metrics in detail to gain deeper insights.
- Dynamic Filtering: Adjust data views based on selected parameters for focused analysis.
- Visualization Customization: Alter how data is presented based on personal or departmental preferences.
- Real-Time Interaction: Engage with up-to-date data, ensuring decisions are made on the most recent information.
Interactive Dashboards are more than mere data displays; they're adaptable tools that empower users to delve into the specifics of their business metrics, offering a tailored analytical experience.
Affordable, Quick and Engaging Power BI Dashboards for Strategic Insights
Microsoft Power BI, paired with the expertise of VC ERP Consulting Pvt Ltd, becomes an irreplaceable asset for businesses. These dashboards are not just about showing numbers and graphs but about narrating a story.
They transform complex data into intelligible insights, drive decisions with real-time data, and enable all stakeholders to interact seamlessly with the data.
With VC ERP Consulting Pvt Ltd's dedication to crafting specialized, no-code Power BI dashboards, companies can refocus on informed decision-making and business growth. If clarity in data is what you seek, VC ERP Consulting is poised to illuminate the path.
If you are considering purchasing custom no-code Power BI Dashboards that are quick and easy to implement and require low-to-no maintenance with realtime insights, then VC ERP Consulting is at your service. Call +91 7948998911 (India), Whatsapp +254 111229970 (Kenya), Call +1 469 915 6026 (North America) or drop an E-mail at sayhello@vc-erp.com

How Microsoft Power BI positions SME Businesses for Success

Power BI vs SAC: Which BI Solution Reigns Supreme in Business Intelligence?

Top Ways Power BI Shares Compelling Business Insights with Data Visualization
VC ERP Consulting × Your Business- Let’s Unleash Your Business’s Potential. Together.
We believe that success begins with meaningful connections. That's why we invite you to start a conversation with us.
Our Partners


Let’s Do This. Contact Us!
Apply for Job
"*" indicates required fields