- Home
- SAP Solutions & Services
- Solutions
- SAP Business One
- Analytics and Reporting
SAP Analytics Solutions For SAP Business One
When using SAP Business One, Analytics has become an integral part to gauge your business performance. Each business makes substantial investments that help in accessing large chunks of data. However, all this gold mine of data goes to waste when business leaders cannot interpret the story your data tells. SAP Business One Analytics and Reporting gives this strong foundation to establish, analyze and measure your business performance for insightful decision-making.
Reporting Tools for SAP Business One
Crystal Reports Dashboard
One solution for both reporting and printing needs for your business information
Compatible with

for MS SQL

Version for HANA
Understanding Crystal Reports Dashboard
Expert consultants at VC ERP consulting provide seamless configuration of Crystal Reports and customize dashboards for all your business functions including sales, finance purchase and more. We also assist you to create personalized dashboards.
Now, control all the complex data and give it an insightful dashboard design. SAP Crystal reports dashboard tool can help you turn any raw data into an interactive dashboard giving you a deeper understanding of the data providing better insights in the decision making process.
Differentiators
Tightly Integrated
Pixel-Perfect
Interactive Reports
Flexible Reporting Software
Key Features
Report Design Environment
Integrated Viewer with Accurate Print Preview
Export to PDF, XML & MS Excel
How you can use Crystal Reports Dashboard
Create personalized dashboards for all the business modules like sales, Finance, Purchase and so on. Control all the complex data and give it an insightful design. Creating Interactive dashboards from raw data made easy.
Gain a better understanding of the decision making process with the help of this highly effective tool.
License


Pervasive Analytics & Pervasive Dashboards within SAP Business One
Uncover relevant information for critical decision-making from your data right from your system
Reporting Tools for SAP Business One
Crystal Reports Dashboard
One solution for both reporting and printing needs for your business information
Compatible with
for HANA
Understanding Pervasive Analytics & Pervasive Dashboards
Pervasive Analytics & Pervasive Dashboards for SAP Business One version for HANA provides you with access and helps you visualize your data with detailed customization. This application provides three analytics tools that boost your decision making process.

On your Own Cockpit

Fully integrated in Cockpit or Sidebars

Personal-relevant Dashboards & KPIs

Real-time Insights

Take Direct Action
Key Features

Dashboards & KPIs
Advanced Dashboards
Insight-to-Action
How you can use Pervasive Analytics & Pervasive Dashboards
Key Performance Indicators: Design KPIs by customizing data using this single touch tool.
Pervasive Dashboards: Customize data to design pervasive dashboards using a few clicks. View them in action on the advanced dashboard or in your cockpit.
Advanced Dashboards: Design advanced dashboards to contain various widgets and view them in pages. Retrieve specific data using filters.
License

license needed
Excel Report & Interactive Analysis Designer
Analyze your business information interactively using MS Excel pivot table and discover new business insights – useful for any business user
Compatible with
Version for HANA
Understanding Excel Report & Interactive Analysis Designer
The excel interactive reports provide a report designer and pre-defined reports to make the data flow easy in the company. When the functions of excel report and interactive analysis are clubbed together, the designer tool helps you create interactive reports. In addition, the in-memory computing technology of HANA gets you real time updates from the reports giving instant access to all the data.
Differentiators
Ad hoc Reporting For Users
Slice & Dice Reports as Required
Based on MS Excel
Tightly Integrated in SAP Business One
Key Features
Acquire data from SAP HANA models (Semantic Layers)
Enrich, Calculate and Edit Data
Visualize datasets by numerous chart options
How you can use Excel Interactive Reports
Design KPIs by customizing data using this single touch tool
Customize data to design pervasive dashboards using a few clicks
Design advanced dashboards to contain various widgets and view them in pages
License

High-End Analytics & Management Dashboards
SAP Analytics helps you to analyze large data and predict future outcomes and behaviors. It automates manual analysis.
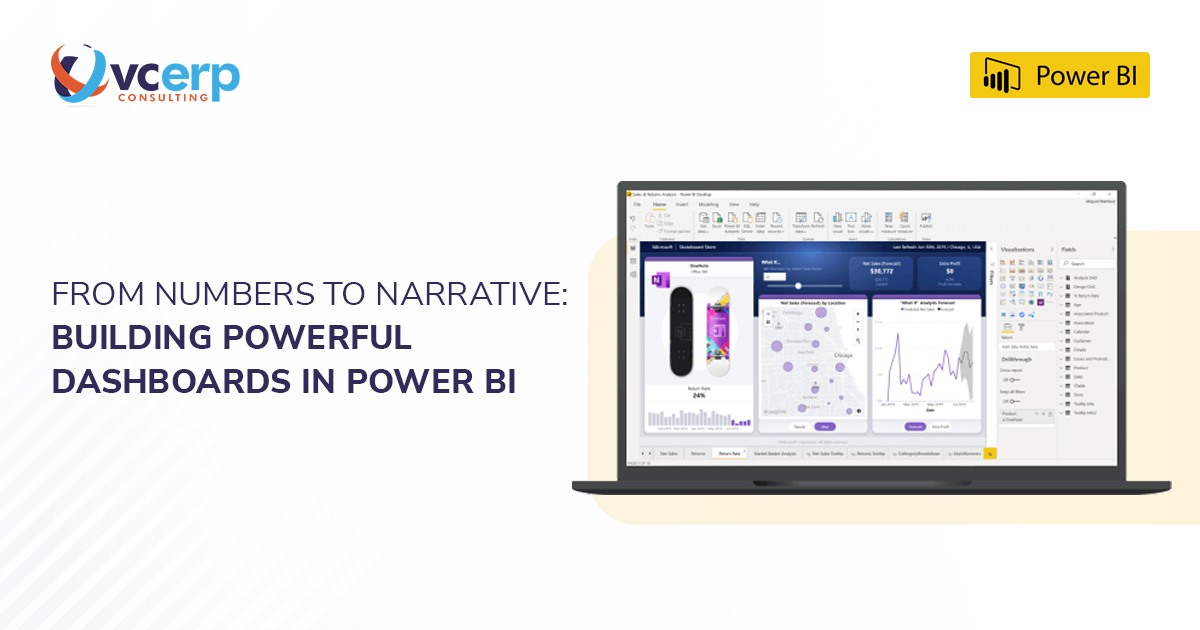
Microsoft Power BI
Microsoft Power BI lets you easily connect to your data sources, visualize and discover what’s important, and share that with anyone or everyone you want
Compatible with
for MS SQL
for HANA
Understanding High-End Analytics & Management Dashboards
Microsoft Power BI is an affordable business analytics and intelligence service powered by Microsoft which gives interactive insights using live dashboards, rich reports with the facility of accessing data on-the-move from mobile devices.
Elements of BI

Power BI Desktop

Power BI Service

Power BI Mobile Apps

Power BI Gateway
What does Power BI let you do?
Manage a Self-Service Business Intelligence (SSBI) for your Business Operations
Create and Share Dashboards and Visual Reports
Use Data Modelling and Navigation
Transform and Shape Organizational Data into relevant Insights
Develop and Import Optimized Data Models
Prepare Interactive Power BI reports
Power BI Differentiators
Pre-built dashboards & reports for popular SaaS solutions
Live, Real-time Dashboards
Secure, Live connectivity to your data sources, on-premises & in the Cloud

Intuitive data exploration using natural language query functionality
Auto insights into your datasets & reports
SAP Analytics Cloud
BI, Planning and Analytics powered by SAP HANA on the Cloud for SAP Business One
Powered by SAP HANA
Compatible with
for HANA
Understanding SAP Analytics Cloud
The SAP Analytics Cloud is a SaaS-based product that combines BI, augmented and predictive analytics, and planning capabilities into one cloud environment.
Differentiators

Business Intelligence

Collaborative Enterprise Planning

Data Modelling

Augmented Analytics

Predictive Planning

Implementation
Key Features

Real-Time Analytics

Acquire Data from Relevant Databases

Enrich the Data

Create Stories

Collaborate with Other Users

Share Stories & Insights with Relevant Users and Teams
What does SAC let you do?
Explore data across the organisation & deliver insights at the point of decision with intuitive self-service analytics
Gain business insights directly from a Web browser without installing install new software on your desktop
Visualize data and make findings easy to understand
Eliminate the need to install and maintain new software on your desktop
Link & create financial and operational plans seamlessly in one solution to drive better decisions with integrated plans.
SAC has augmented analytics capabilities powered by AI, machine learning, and natural language processing built into BI and planning workflows.
Create centrally governable analytic content – from guided analytics to sophisticated planning and smart applications.
Access analytics with an iPhone or iPad to get the most recent information about your business anytime, anywhere.
Tableau
Tableau is the fastest growing data visualization tool used in the business intelligence industry. Simplify any raw data using this tool. Non-technical users can also create customized dashboards using this tool.
Understanding Tableau
Tableau is a perfect analysis tool which makes your work easier and faster. It connects and extracts data from various places and pulls data from any platform you can imagine.
Differentiators
The best part about Tableau is that it does not require any technical skill to operate.

Data Blending

Real Time Analysis

Collaboration of Data
Key Features

Ad Hoc Analysis, Reporting & Query

Customizable Reporting & Dashboard Creation

Content Library & Interactive Content

Easy Data Modelling

Real Time Analytics using Real Time Data

Geographic maps using Geo-location

Drag & Drop Integration

Offline Access
What does Tableau let you do?
Share data Insights and collaborate with your colleagues
Create and upload workbooks right on the web
Use dashboard starters
Build and publish data sources and workbooks from the browser or desktop site
Create data alerts, custom views & download content (options vary based on permissions)
See published and custom views others have created & more
Services for Business One Analytics and Reporting
Business Intelligence Consulting
Experts at VC ERP Consulting understand how to combine your data and model it to create customized visual dashboards for all your analytics needs for the latest insights of all the business activities
MIS Reporting & Analytics Design
We enable department, business function and industry-specific MIS Reports and Analytics with unique customized easy to understand corresponding dashboards to save time and effort for all the stakeholders
Systems Feasibility and Data Pattern Discovery
Our export consultants dive deep into your business to understand your processes so we can streamline them and discover critical challenges that need to be prioritized for better performance
Customized Dashboards Development
We understand your requirements in-depth and create dashboards exactly as your business needs in a way that your managers, analysts and business leaders can all make informed decisions without the hassle of creating and developing dashboards from scratch
Migration to HANA for Real-Time Insights
SAP Business One Analytics & Reporting runs faster on HANA giving real time insights of your business boosting the financial performance of the business
Integration with SAP BW
Ideal for growing companies at a medium scale, our expert consultants with their rich experience of over two decades understand businesses inside out and help integrate solutions like SAP Business Warehouse with your SAP Business One ensuring that sharp competitive edge of your company over everyone else
Training & Support
We walk you through every step of the way allowing you to foster a culture of learning and idea exchange in your organization while making it easier to grasp using SAP Business One Analytics and Reporting tools efficiently and quickly
License & User-compliance Audit
As an SAP Gold Partner, we suggest the best possible solutions and carry out the license procurement for your specific business needs with a quick and seamless installation experience for SAP Business One so you can focus on running the business while leaving the hassles to professionals like us
Blog
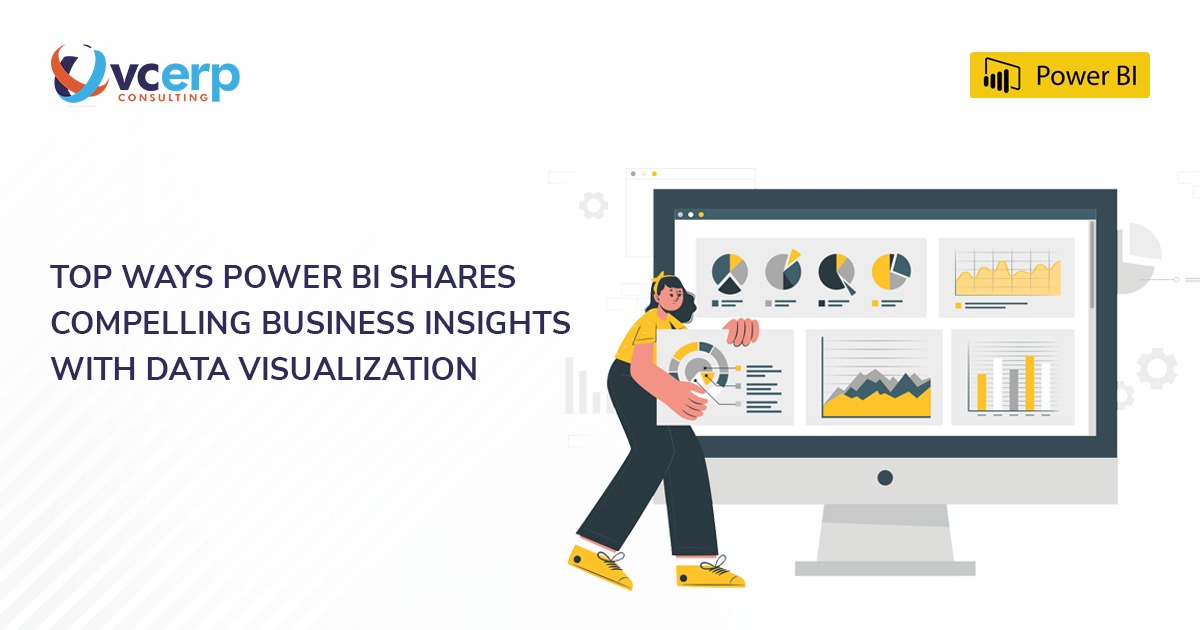
Top Ways Power BI Shares Compelling Business Insights with Data Visualization
Tips for Creating a Successful Digital Transformation Roadmap for Total Business Management